New Account and Pod Dashboards
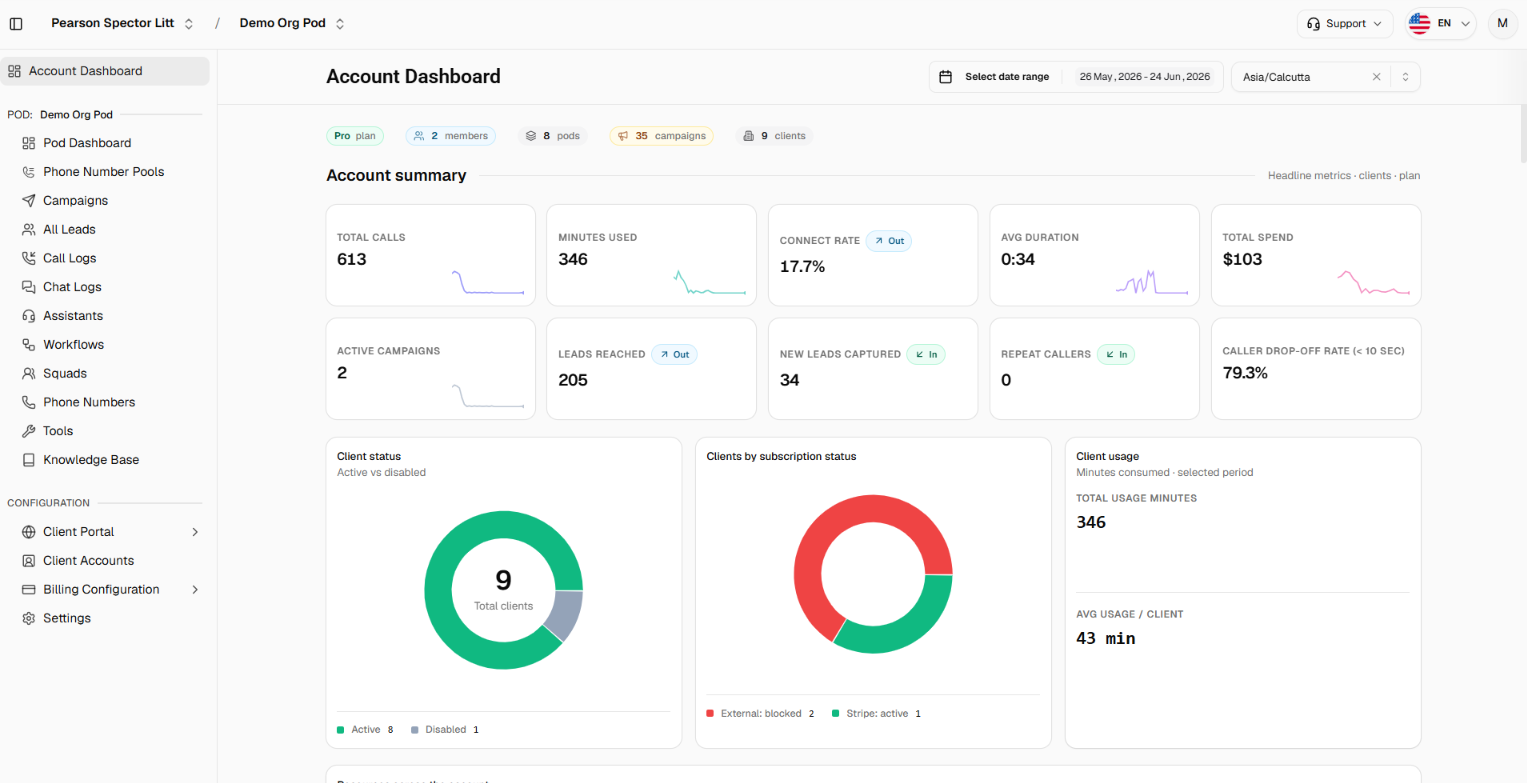
The old account overview has been replaced with two dedicated dashboards that give you a much clearer picture of activity, spend, and account health: one for your whole account, and one for each pod.
Account Dashboard
A full overview across all of your pods and clients:
Headline metrics for total calls, minutes used, connect rate, average call duration, total spend, active campaigns, leads reached, new inbound leads, repeat callers, and caller drop-off rate, each with a small trend line.
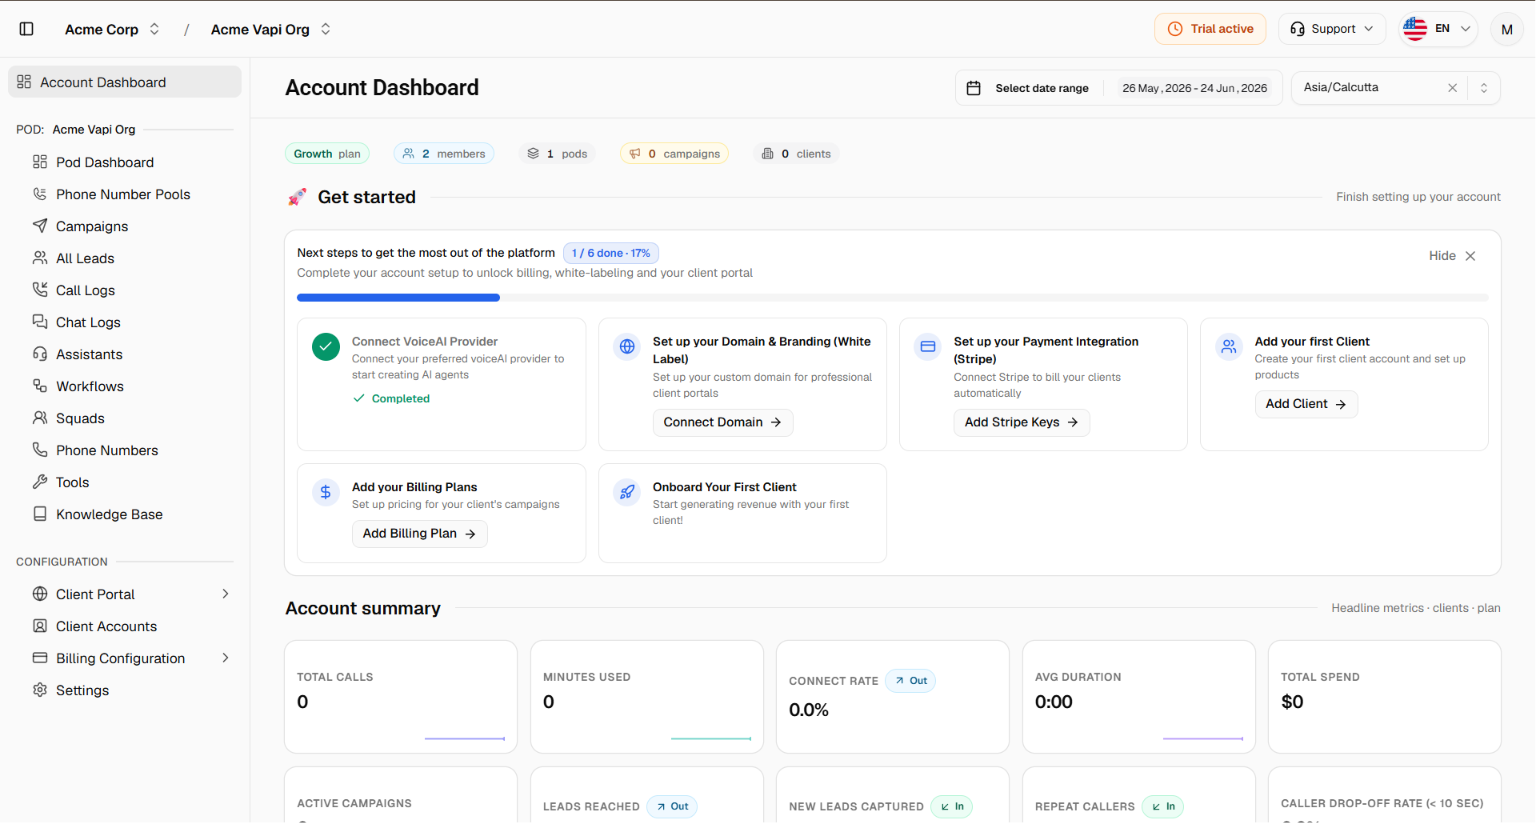
Setup checklist showing what's left to finish setting up your account (connect a provider, branding, payment, first client, first campaign, invite your team).
Plan usage gauges for campaigns, team members, and clients against your plan limits.
Client insights: active vs. disabled clients, breakdown by subscription status, and usage per client.
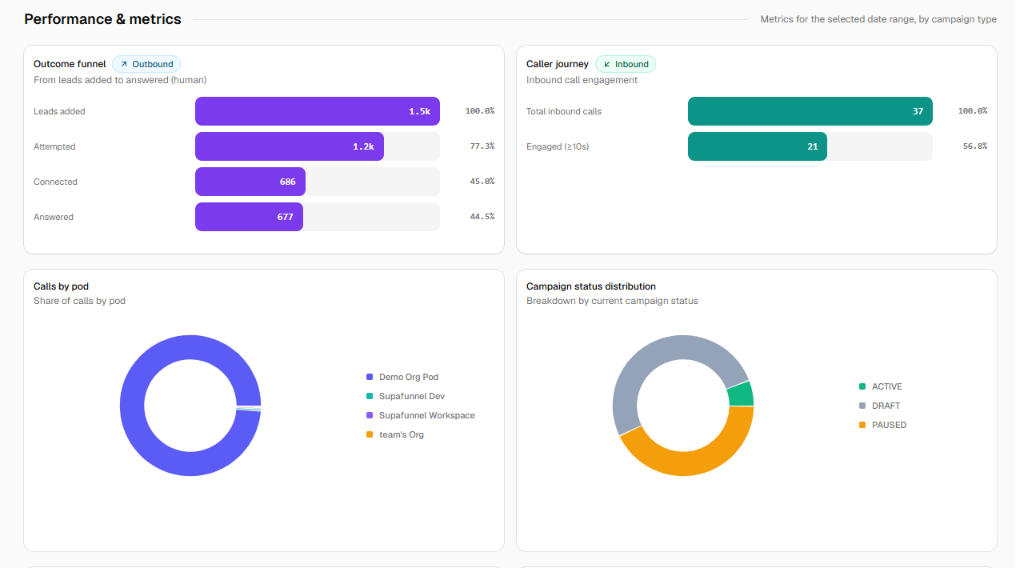
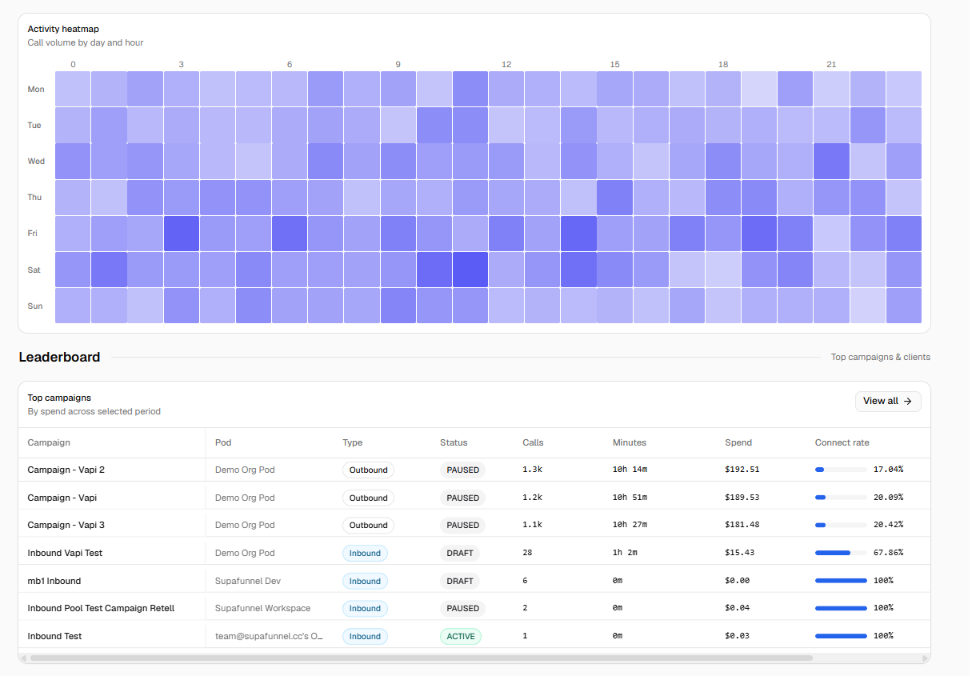
Performance views: outbound outcome funnel, inbound caller journey, calls by pod, campaign status breakdown, spend by provider, lead pipeline, and an activity heatmap by day and hour.
Leaderboards for your top campaigns by spend and top clients by usage.
Resource summary of pods, campaigns, phone numbers, widgets, assistants, members, and more.
Date range controls (7 / 30 / 90 days or a custom range).
Pod Dashboard
A focused view of a single pod:
Combined and split metrics for inbound and outbound: connect rate, voicemail detection, cost per minute, leads reached, new leads, repeat callers, and short hang-up rate.
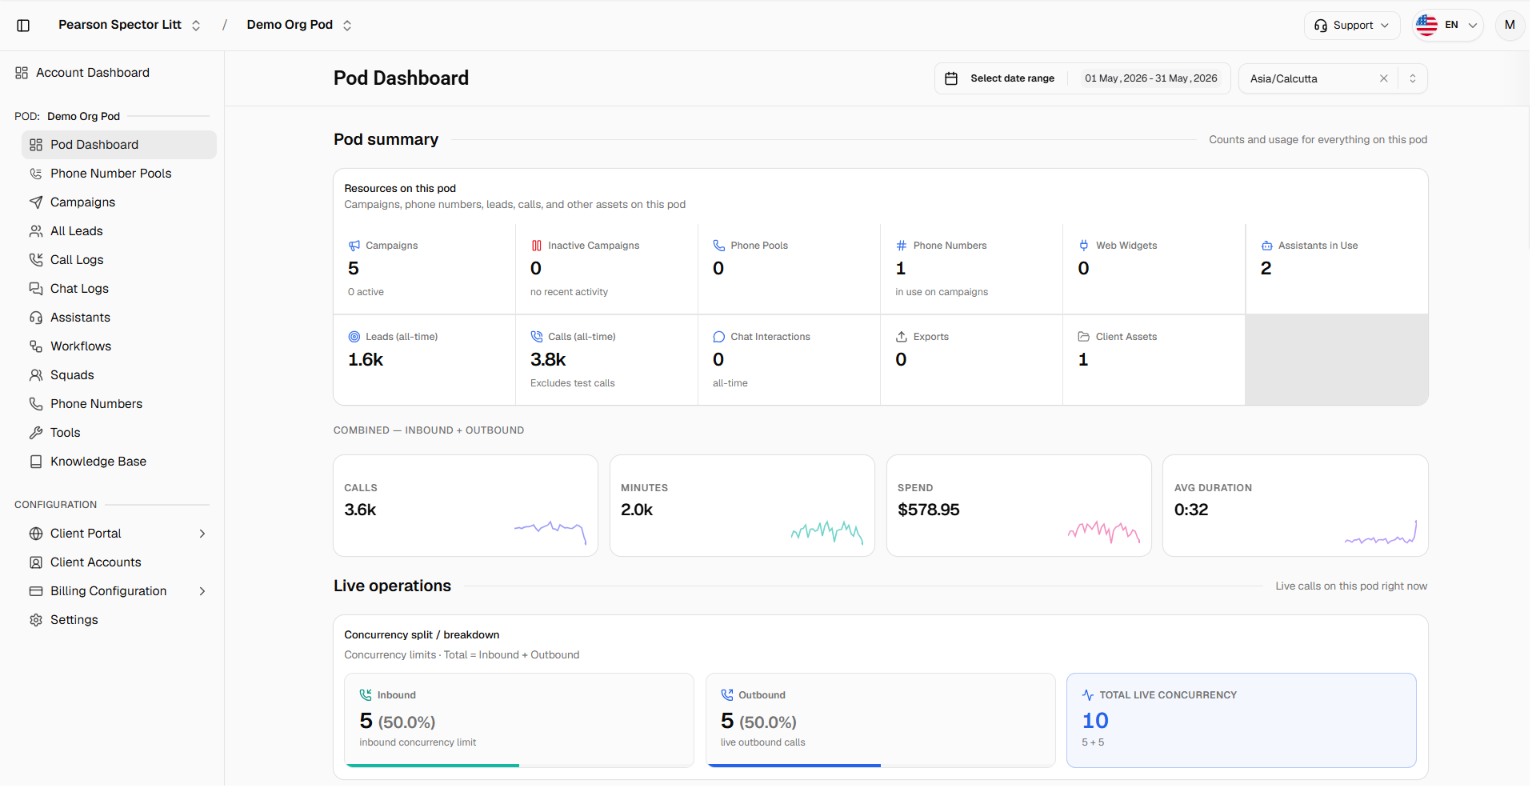
Concurrency distribution across all the pods.
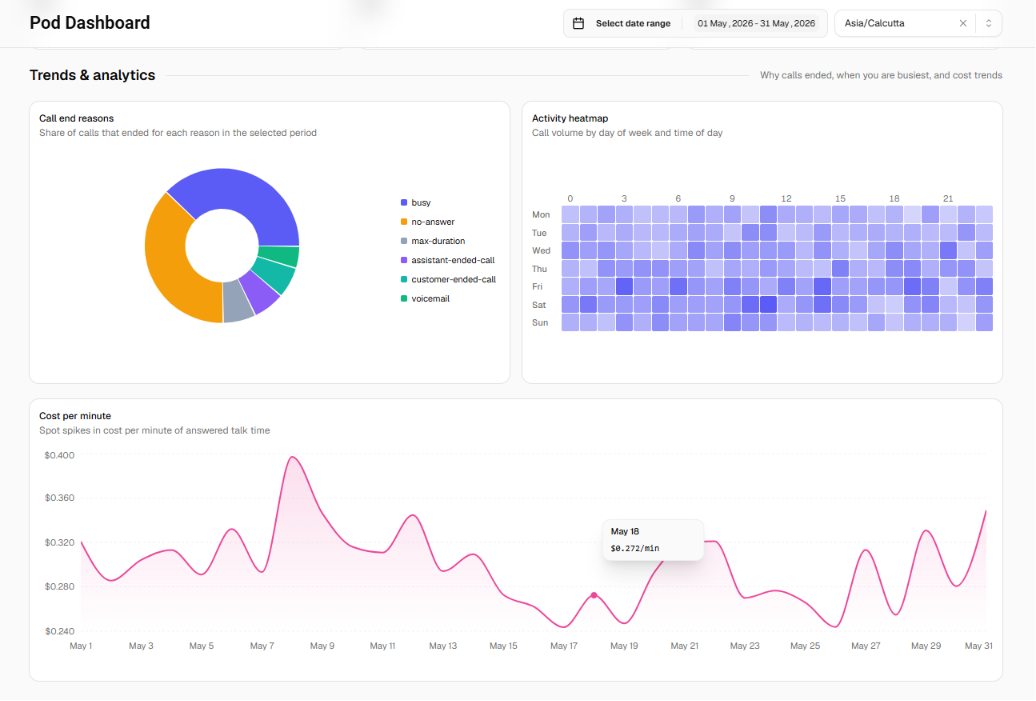
Call outcomes chart (where calls ended), an activity heatmap, and a cost-per-answered-minute trend.
Top campaigns on the pod and a recent calls list with outcomes, durations, costs, and summaries.
Inactive campaign alerts for campaigns with no calls in the last 14 days, with snooze or delete options.